GEO PERFORMANCE
RAIDAR
A control system to understand and improve brand performance in LLMs.


THREE SYSTEM PHASES
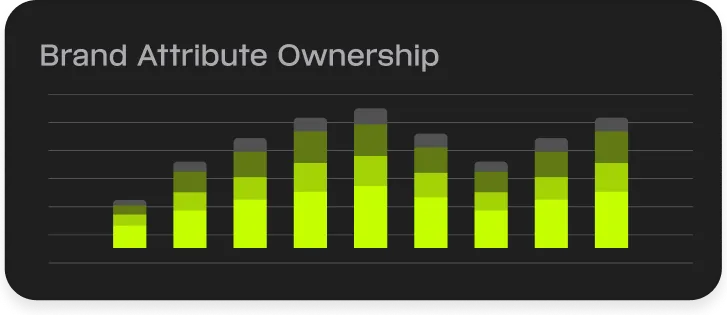
Monitor
LLM-Visibility
How is AI talking about your brand?
A Deep Research Engine measures how your brand, products and messages perform in LLMs by simulating real prompts and consumer behavior in context.
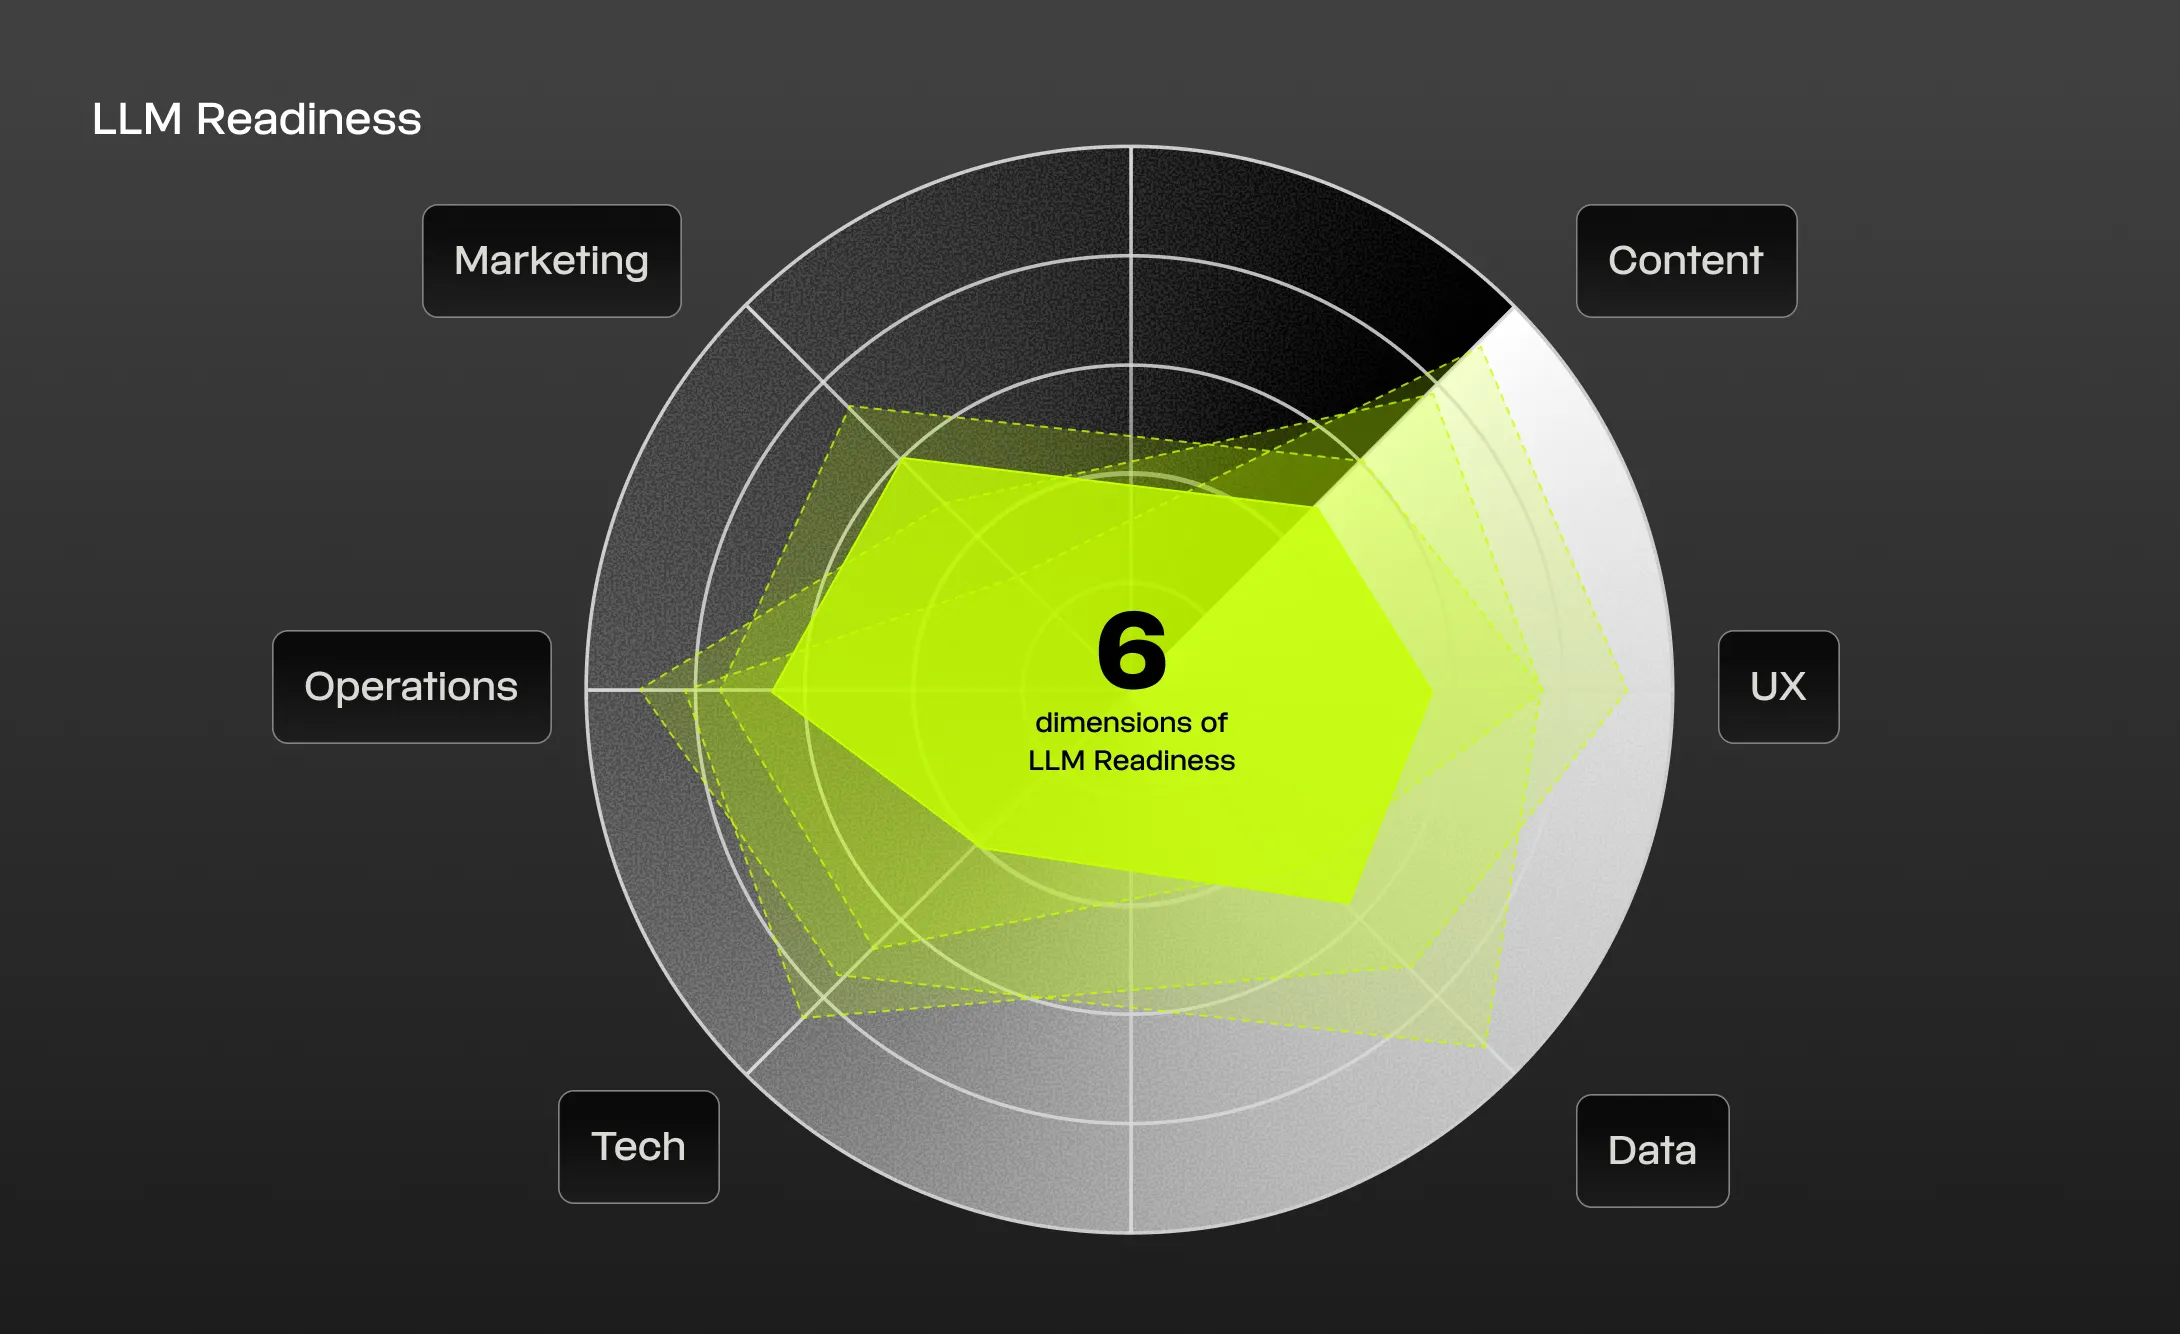
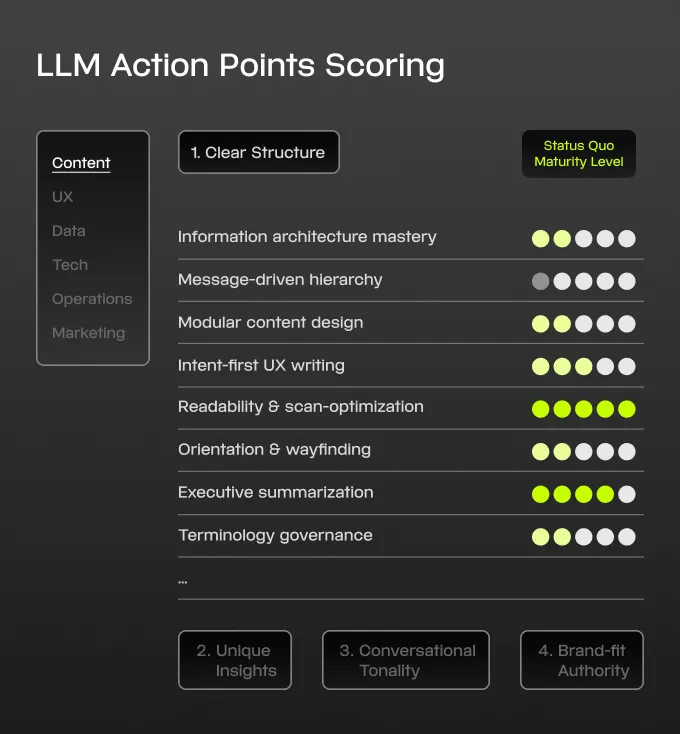
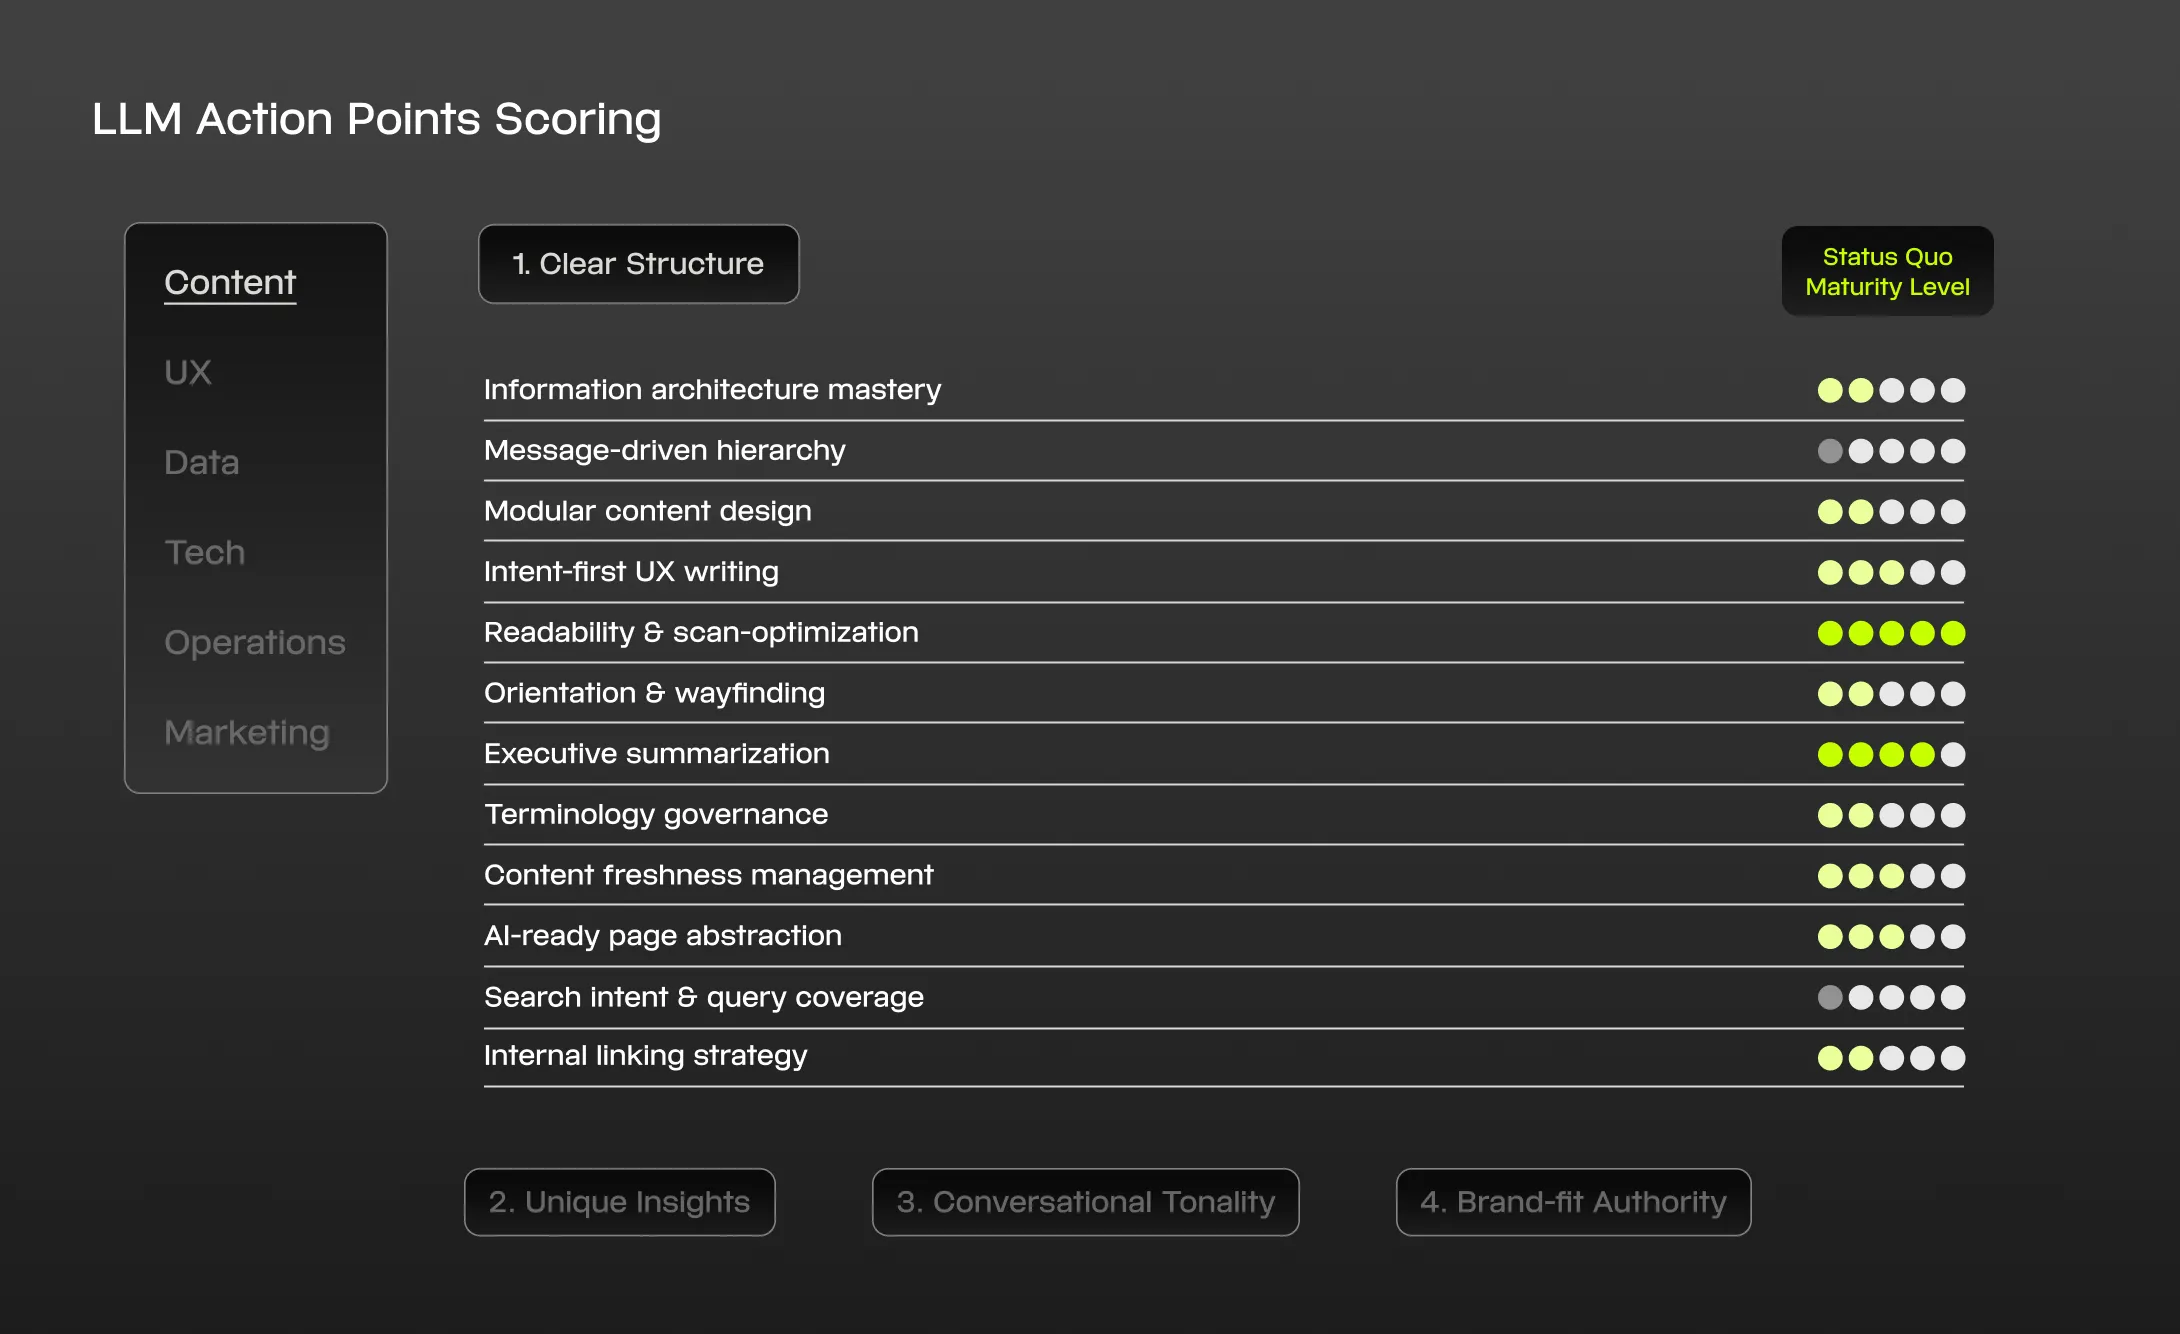
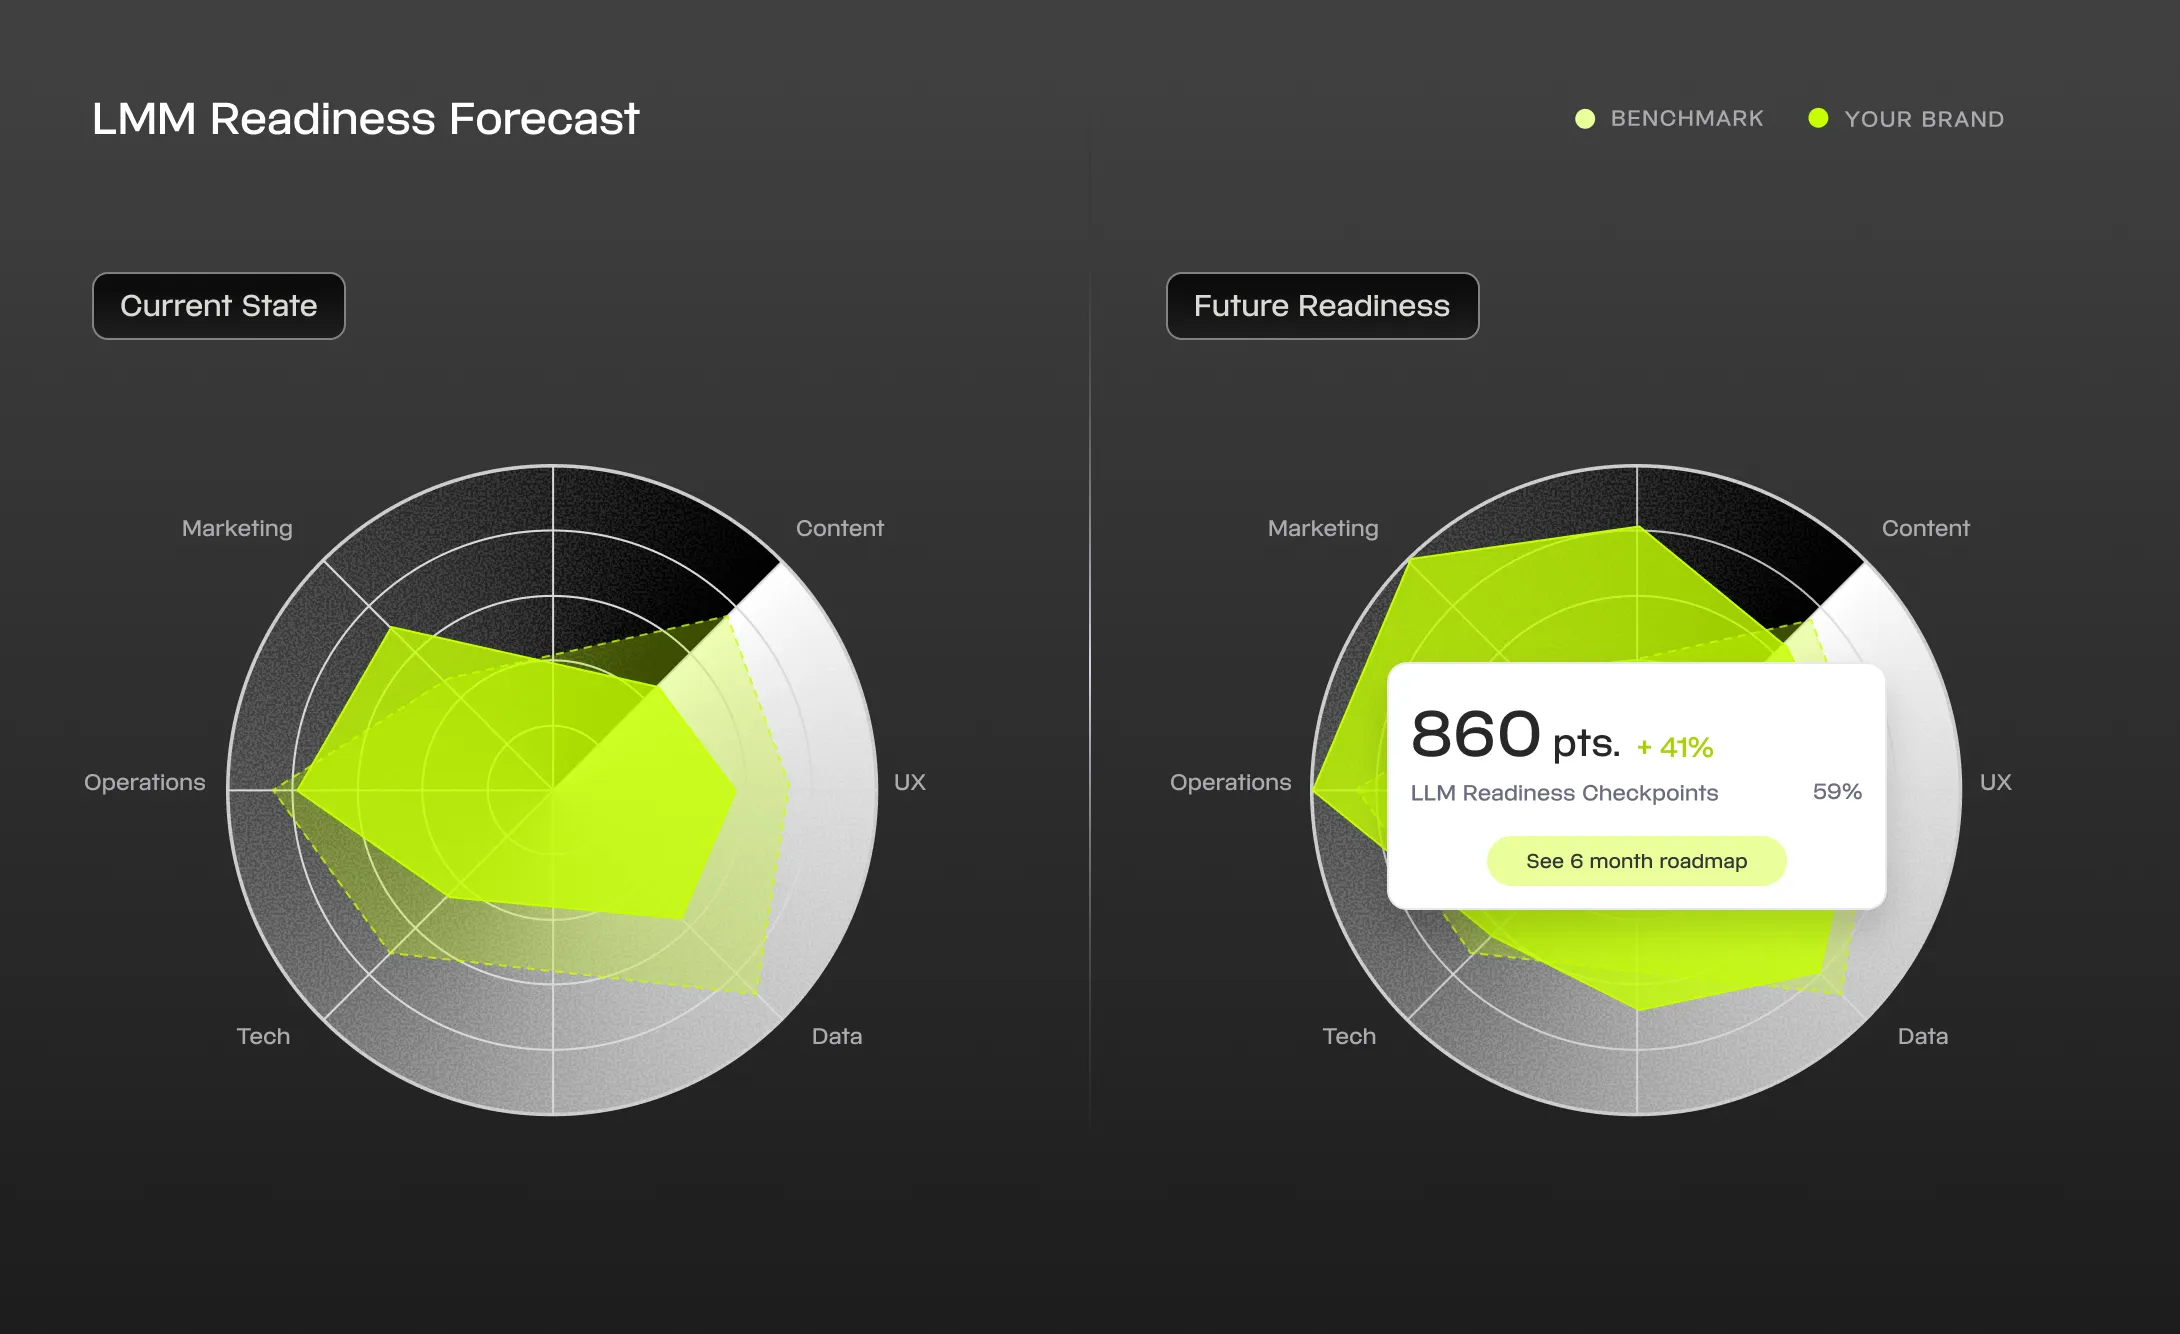
Assess
Business Readiness
Is your marketing setup AI-ready?
With a Tactical Maturity Audit, we examine your current LLM readiness across tech, operations, CX, data, content and communication.
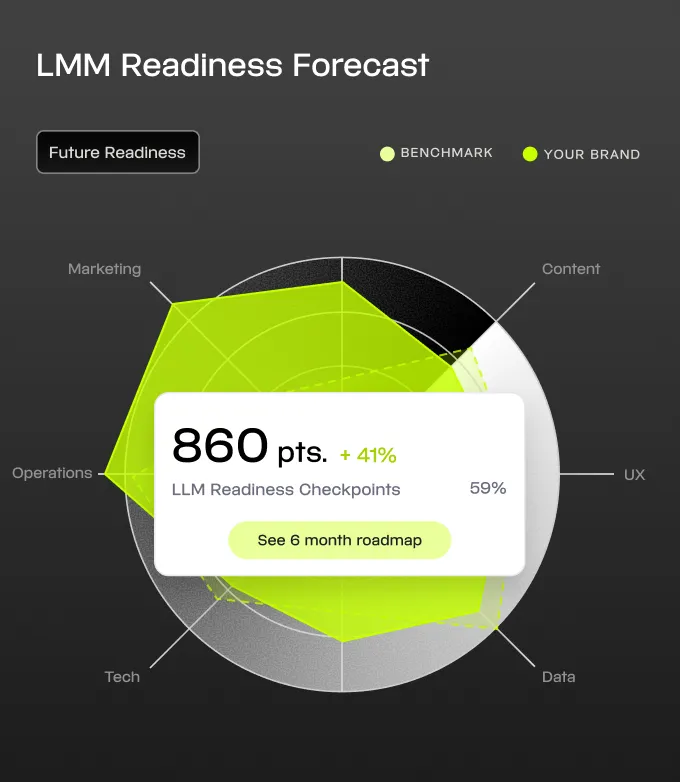
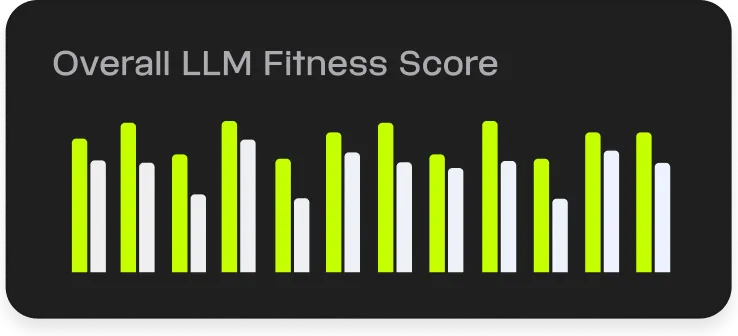
Improve
LLM-Fitness
Is your performance evolving?
We translate results into concrete transformation programs and support implementation across teams, systems and processes.